


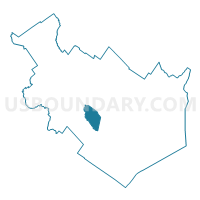
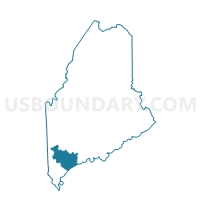
Census Tract 48.03, Cumberland County, Maine
About
Outline

Summary
| Unique Area Identifier | 461297 |
| Name | Census Tract 48.03 |
| County | Cumberland County |
| State | Maine |
| Area (square miles) | 18.98 |
| Land Area (square miles) | 18.60 |
| Water Area (square miles) | 0.39 |
| % of Land Area | 97.96 |
| % of Water Area | 2.04 |
| Latitude of the Internal Point | 43.76071820 |
| Longtitude of the Internal Point | -70.40823860 |
| Total Population | 5,745 |
| Total Housing Units | 2,023 |
| Total Households | 1,915 |
| Median Age | 40.1 |
Maps
Graphs
Select a template below for downloading or customizing gragh for Census Tract 48.03, Cumberland County, Maine


Neighbors
Neighoring Census Tract (by Name) Neighboring Census Tract on the Map
- Census Tract 25.02, Cumberland County, ME
- Census Tract 27, Cumberland County, ME
- Census Tract 40.01, Cumberland County, ME
- Census Tract 41, Cumberland County, ME
- Census Tract 48.01, Cumberland County, ME
- Census Tract 48.02, Cumberland County, ME
Top 10 Neighboring County Subdivision (by Population) Neighboring County Subdivision on the Map
- Westbrook city, Cumberland County, ME (17,494)
- Windham town, Cumberland County, ME (17,001)
- Gorham town, Cumberland County, ME (16,381)
- Falmouth town, Cumberland County, ME (11,185)
Top 10 Neighboring Place (by Population) Neighboring Place on the Map
- Westbrook city, ME (17,494)
- North Windham CDP, ME (4,904)
- South Windham CDP, ME (1,374)
- Little Falls CDP, ME (708)
Top 10 Neighboring Unified School District (by Population) Neighboring Unified School District on the Map
- Regional School Unit 14, ME (21,437)
- Westbrook, ME (17,494)
- Gorham, ME (16,381)
- Falmouth, ME (11,185)
Top 10 Neighboring State Legislative District Lower Chamber (by Population) Neighboring State Legislative District Lower Chamber on the Map
- State House District 129, ME (10,087)
- State House District 110, ME (9,519)
- State House District 111, ME (9,395)
- State House District 125, ME (8,916)
- State House District 112, ME (8,847)
Top 10 Neighboring State Legislative District Upper Chamber (by Population) Neighboring State Legislative District Upper Chamber on the Map
- State Senate District 6, ME (40,612)
- State Senate District 12, ME (39,339)
- State Senate District 11, ME (38,642)
- State Senate District 9, ME (38,256)
Top 10 Neighboring 111th Congressional District (by Population) Neighboring 111th Congressional District on the Map
Top 10 Neighboring 5-Digit ZIP Code Tabulation Area (by Population) Neighboring 5-Digit ZIP Code Tabulation Area on the Map
Explore Neighbors on the MapData
Demographic, Population, Households, and Housing Units
** Data sources from census 2010 **
Show Data on Map
Download Full List as CSV
Download Quick Sheet as CSV
| Subject | This Area | Cumberland County | Maine | National |
|---|---|---|---|---|
| POPULATION | ||||
| Total Population Map | 5,745 | 281,674 | 1,328,361 | 308,745,538 |
| POPULATION, HISPANIC OR LATINO ORIGIN | ||||
| Not Hispanic or Latino Map | 5,707 | 276,629 | 1,311,426 | 258,267,944 |
| Hispanic or Latino Map | 38 | 5,045 | 16,935 | 50,477,594 |
| POPULATION, RACE | ||||
| White alone Map | 5,550 | 261,396 | 1,264,971 | 223,553,265 |
| Black or African American alone Map | 62 | 6,781 | 15,707 | 38,929,319 |
| American Indian and Alaska Native alone Map | 18 | 901 | 8,568 | 2,932,248 |
| Asian alone Map | 41 | 5,769 | 13,571 | 14,674,252 |
| Native Hawaiian and Other Pacific Islander alone Map | 2 | 87 | 342 | 540,013 |
| Some Other Race alone Map | 4 | 1,557 | 4,261 | 19,107,368 |
| Two or More Races Map | 68 | 5,183 | 20,941 | 9,009,073 |
| POPULATION, SEX | ||||
| Male Map | 3,055 | 136,684 | 650,056 | 151,781,326 |
| Female Map | 2,690 | 144,990 | 678,305 | 156,964,212 |
| POPULATION, AGE (18 YEARS) | ||||
| 18 years and over Map | 4,551 | 222,780 | 1,053,828 | 234,564,071 |
| Under 18 years | 1,194 | 58,894 | 274,533 | 74,181,467 |
| POPULATION, AGE | ||||
| Under 5 years | 272 | 14,755 | 69,520 | 20,201,362 |
| 5 to 9 years | 356 | 16,217 | 74,116 | 20,348,657 |
| 10 to 14 years | 347 | 17,172 | 79,013 | 20,677,194 |
| 15 to 17 years | 219 | 10,750 | 51,884 | 12,954,254 |
| 18 and 19 years | 116 | 7,849 | 36,426 | 9,086,089 |
| 20 years | 79 | 3,583 | 17,408 | 4,519,129 |
| 21 years | 56 | 3,509 | 16,566 | 4,354,294 |
| 22 to 24 years | 226 | 10,516 | 45,672 | 12,712,576 |
| 25 to 29 years | 396 | 17,512 | 72,681 | 21,101,849 |
| 30 to 34 years | 384 | 16,646 | 71,943 | 19,962,099 |
| 35 to 39 years | 410 | 18,255 | 79,905 | 20,179,642 |
| 40 to 44 years | 520 | 20,651 | 91,471 | 20,890,964 |
| 45 to 49 years | 541 | 23,234 | 107,619 | 22,708,591 |
| 50 to 54 years | 516 | 22,861 | 110,956 | 22,298,125 |
| 55 to 59 years | 384 | 20,679 | 102,441 | 19,664,805 |
| 60 and 61 years | 112 | 7,398 | 37,823 | 7,113,727 |
| 62 to 64 years | 181 | 9,930 | 51,837 | 9,704,197 |
| 65 and 66 years | 104 | 5,224 | 28,116 | 5,319,902 |
| 67 to 69 years | 135 | 6,804 | 36,898 | 7,115,361 |
| 70 to 74 years | 138 | 8,557 | 47,637 | 9,278,166 |
| 75 to 79 years | 109 | 7,160 | 38,894 | 7,317,795 |
| 80 to 84 years | 73 | 5,976 | 30,399 | 5,743,327 |
| 85 years and over | 71 | 6,436 | 29,136 | 5,493,433 |
| MEDIAN AGE BY SEX | ||||
| Both sexes Map | 40.10 | 41.00 | 42.70 | 37.20 |
| Male Map | 38.90 | 39.60 | 41.50 | 35.80 |
| Female Map | 41.50 | 42.30 | 43.80 | 38.50 |
| HOUSEHOLDS | ||||
| Total Households Map | 1,915 | 117,339 | 557,219 | 116,716,292 |
| HOUSEHOLDS, HOUSEHOLD TYPE | ||||
| Family households: Map | 1,445 | 70,778 | 350,621 | 77,538,296 |
| Husband-wife family Map | 1,175 | 54,885 | 270,088 | 56,510,377 |
| Other family: Map | 270 | 15,893 | 80,533 | 21,027,919 |
| Male householder, no wife present Map | 90 | 4,537 | 25,085 | 5,777,570 |
| Female householder, no husband present Map | 180 | 11,356 | 55,448 | 15,250,349 |
| Nonfamily households: Map | 470 | 46,561 | 206,598 | 39,177,996 |
| Householder living alone Map | 347 | 34,831 | 159,533 | 31,204,909 |
| Householder not living alone Map | 123 | 11,730 | 47,065 | 7,973,087 |
| HOUSEHOLDS, HISPANIC OR LATINO ORIGIN OF HOUSEHOLDER | ||||
| Not Hispanic or Latino householder: Map | 1,909 | 115,966 | 552,753 | 103,254,926 |
| Hispanic or Latino householder: Map | 6 | 1,373 | 4,466 | 13,461,366 |
| HOUSEHOLDS, RACE OF HOUSEHOLDER | ||||
| Householder who is White alone | 1,872 | 111,615 | 538,973 | 89,754,352 |
| Householder who is Black or African American alone | 7 | 1,952 | 4,260 | 14,129,983 |
| Householder who is American Indian and Alaska Native alone | 4 | 370 | 3,316 | 939,707 |
| Householder who is Asian alone | 8 | 1,635 | 3,655 | 4,632,164 |
| Householder who is Native Hawaiian and Other Pacific Islander alone | 0 | 24 | 98 | 143,932 |
| Householder who is Some Other Race alone | 1 | 402 | 1,129 | 4,916,427 |
| Householder who is Two or More Races | 23 | 1,341 | 5,788 | 2,199,727 |
| HOUSEHOLDS, HOUSEHOLD TYPE BY HOUSEHOLD SIZE | ||||
| Family households: Map | 1,445 | 70,778 | 350,621 | 77,538,296 |
| 2-person household Map | 613 | 33,088 | 173,649 | 31,882,616 |
| 3-person household Map | 356 | 16,629 | 79,656 | 17,765,829 |
| 4-person household Map | 313 | 13,776 | 62,338 | 15,214,075 |
| 5-person household Map | 106 | 4,907 | 23,357 | 7,411,997 |
| 6-person household Map | 38 | 1,582 | 7,746 | 3,026,278 |
| 7-or-more-person household Map | 19 | 796 | 3,875 | 2,237,501 |
| Nonfamily households: Map | 470 | 46,561 | 206,598 | 39,177,996 |
| 1-person household Map | 347 | 34,831 | 159,533 | 31,204,909 |
| 2-person household Map | 111 | 9,792 | 40,046 | 6,360,012 |
| 3-person household Map | 9 | 1,345 | 4,684 | 992,156 |
| 4-person household Map | 3 | 418 | 1,672 | 411,171 |
| 5-person household Map | 0 | 131 | 483 | 126,634 |
| 6-person household Map | 0 | 26 | 108 | 48,421 |
| 7-or-more-person household Map | 0 | 18 | 72 | 34,693 |
| HOUSING UNITS | ||||
| Total Housing Units Map | 2,023 | 138,657 | 721,830 | 131,704,730 |
| HOUSING UNITS, OCCUPANCY STATUS | ||||
| Occupied Map | 1,915 | 117,339 | 557,219 | 116,716,292 |
| Vacant Map | 108 | 21,318 | 164,611 | 14,988,438 |
| HOUSING UNITS, OCCUPIED, TENURE | ||||
| Owned with a mortgage or a loan Map | 1,278 | 58,138 | 264,218 | 52,979,430 |
| Owned free and clear Map | 311 | 20,407 | 133,199 | 23,006,644 |
| Renter occupied Map | 326 | 38,794 | 159,802 | 40,730,218 |
| HOUSING UNITS, VACANT, VACANCY STATUS | ||||
| For rent Map | 11 | 2,738 | 15,738 | 4,137,567 |
| Rented, not occupied Map | 1 | 189 | 1,021 | 206,825 |
| For sale only Map | 25 | 1,351 | 9,711 | 1,896,796 |
| Sold, not occupied Map | 8 | 374 | 2,089 | 421,032 |
| For seasonal, recreational, or occasional use Map | 26 | 14,676 | 118,310 | 4,649,298 |
| For migrant workers Map | 0 | 4 | 160 | 24,161 |
| Other vacant Map | 37 | 1,986 | 17,582 | 3,652,759 |
| HOUSING UNITS, OCCUPIED, AVERAGE HOUSEHOLD SIZE BY TENURE | ||||
| Total: Map | 2.64 | 2.32 | 2.32 | 2.58 |
| Owner occupied Map | 2.72 | 2.49 | 2.43 | 2.65 |
| Renter occupied Map | 2.26 | 1.98 | 2.04 | 2.44 |
| HOUSING UNITS, OCCUPIED, TENURE BY RACE OF HOUSEHOLDER | ||||
| Owner occupied: Map | 1,589 | 78,545 | 397,417 | 75,986,074 |
| Householder who is White alone Map | 1,559 | 76,583 | 389,341 | 63,446,275 |
| Householder who is Black or African American alone Map | 7 | 379 | 1,026 | 6,261,464 |
| Householder who is American Indian and Alaska Native alone Map | 2 | 149 | 1,720 | 509,588 |
| Householder who is Asian alone Map | 6 | 772 | 1,943 | 2,688,861 |
| Householder who is Native Hawaiian and Other Pacific Islander alone Map | 0 | 9 | 40 | 61,911 |
| Householder who is Some Other Race alone Map | 1 | 122 | 437 | 1,975,817 |
| Householder who is Two or More Races Map | 14 | 531 | 2,910 | 1,042,158 |
| Renter occupied: Map | 326 | 38,794 | 159,802 | 40,730,218 |
| Householder who is White alone Map | 313 | 35,032 | 149,632 | 26,308,077 |
| Householder who is Black or African American alone Map | 0 | 1,573 | 3,234 | 7,868,519 |
| Householder who is American Indian and Alaska Native alone Map | 2 | 221 | 1,596 | 430,119 |
| Householder who is Asian alone Map | 2 | 863 | 1,712 | 1,943,303 |
| Householder who is Native Hawaiian and Other Pacific Islander alone Map | 0 | 15 | 58 | 82,021 |
| Householder who is Some Other Race alone Map | 0 | 280 | 692 | 2,940,610 |
| Householder who is Two or More Races Map | 9 | 810 | 2,878 | 1,157,569 |
| HOUSING UNITS, OCCUPIED, TENURE BY HISPANIC OR LATINO ORIGIN OF HOUSEHOLDER | ||||
| Owner occupied: Map | 1,589 | 78,545 | 397,417 | 75,986,074 |
| Not Hispanic or Latino householder Map | 1,586 | 77,994 | 395,316 | 69,617,625 |
| Hispanic or Latino householder Map | 3 | 551 | 2,101 | 6,368,449 |
| Renter occupied: Map | 326 | 38,794 | 159,802 | 40,730,218 |
| Not Hispanic or Latino householder Map | 323 | 37,972 | 157,437 | 33,637,301 |
| Hispanic or Latino householder Map | 3 | 822 | 2,365 | 7,092,917 |
| HOUSING UNITS, OCCUPIED, TENURE BY HOUSEHOLD SIZE | ||||
| Owner occupied: Map | 1,589 | 78,545 | 397,417 | 75,986,074 |
| 1-person household Map | 240 | 17,026 | 88,150 | 16,453,569 |
| 2-person household Map | 608 | 31,317 | 168,126 | 27,618,605 |
| 3-person household Map | 313 | 13,133 | 62,975 | 12,517,563 |
| 4-person household Map | 289 | 11,445 | 51,019 | 10,998,793 |
| 5-person household Map | 88 | 3,936 | 18,438 | 5,057,765 |
| 6-person household Map | 34 | 1,173 | 5,953 | 1,965,796 |
| 7-or-more-person household Map | 17 | 515 | 2,756 | 1,373,983 |
| Renter occupied: Map | 326 | 38,794 | 159,802 | 40,730,218 |
| 1-person household Map | 107 | 17,805 | 71,383 | 14,751,340 |
| 2-person household Map | 116 | 11,563 | 45,569 | 10,624,023 |
| 3-person household Map | 52 | 4,841 | 21,365 | 6,240,422 |
| 4-person household Map | 27 | 2,749 | 12,991 | 4,626,453 |
| 5-person household Map | 18 | 1,102 | 5,402 | 2,480,866 |
| 6-person household Map | 4 | 435 | 1,901 | 1,108,903 |
| 7-or-more-person household Map | 2 | 299 | 1,191 | 898,211 |
Loading...